Curve Fitting
The first stage of the pipeline converts raw CETSA dose–response measurements into quantitative biophysical parameters.
Model
Each protein is modeled using a 4-parameter logistic function:
- Baseline response (E0)
- Maximum response (Emax)
- EC50 (half-maximal concentration)
- Hill coefficient (cooperativity)
This captures the characteristic sigmoidal response of protein stability under ligand perturbation.
Key implementation details
- Fitting is performed in log-dose space for numerical stability.
- Monotonic smoothing is applied using isotonic regression to reduce noise.
- Parameter bounds are enforced to avoid unrealistic solutions.
- A mild Hill regularization is used to prevent extreme cooperativity.
Why log-dose space?
NADPH concentrations span several orders of magnitude. Fitting in log space ensures equal weighting across the dynamic range and improves numerical stability of the optimizer.
Quality control
Fits are discarded if they fail basic biological or statistical criteria:
- Low variance in signal
- Poor fit quality (low R²)
- Insufficient effect size (Δmax)
Output
For each protein (and condition), the model returns:
- EC50 and logEC50
- Hill coefficient
- R² (goodness of fit)
- Δmax (effect size)
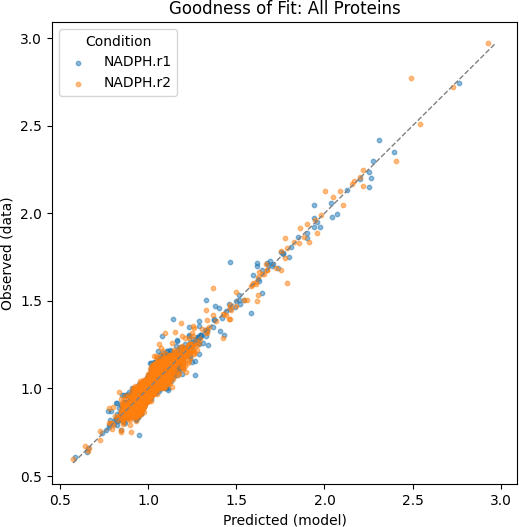
Figure 1: Global goodness-of-fit distribution (R²) across all fitted proteins, indicating the overall quality of the 4PL model.
Interpretation
- Low EC50 indicates high sensitivity to NADPH.
- High Δmax reflects strong stabilization or destabilization.
- R² provides confidence in the estimated parameters.
This stage transforms raw experimental data into interpretable biochemical quantities.