SCIENTIFIC PYTHON · v0.1.0
A fit is only
the beginning.
Turn nonlinear model fits into interpretable uncertainty. Confidence bands, likelihood diagnostics, shared experiments and errors in both axes — with the assumptions in view.
Built for interpretable science
-
Quantify uncertainty
Separate uncertainty in a fitted mean from the noise of a future observation. Use local covariance, profile likelihood or residual resampling deliberately.
-
Connect experiments
Fit unequal datasets together with one optimized degree of freedom for each shared parameter. Derive covariance from the joint Jacobian.
-
Respect measurement error
Account for uncertainty in both predictors and responses with SciPy ODR, while preserving its distinct statistical interpretation.
-
Keep assumptions visible
Read the noise model, reference law, numerical limits and failure behavior alongside the calculation. No uncertainty estimate is assumption-free.
Your model. Ordinary NumPy arrays.
import numpy as np
from scipy.optimize import curve_fit
from curvefit_stats import generate_error_bands

def decay(time, amplitude, rate):
    return amplitude * np.exp(-rate * time)

time = np.linspace(0, 5, 45)
rng = np.random.default_rng(2026)
concentration = decay(time, 3.0, 0.7) + rng.normal(0, 0.08, time.size)
popt, pcov = curve_fit(decay, time, concentration, p0=[2.5, 0.5])
grid = np.linspace(0, 5, 101)
lower, upper = generate_error_bands(
    decay, grid, popt, pcov, concentration, x_fit=time,
)
assert lower.shape == upper.shape == grid.shape
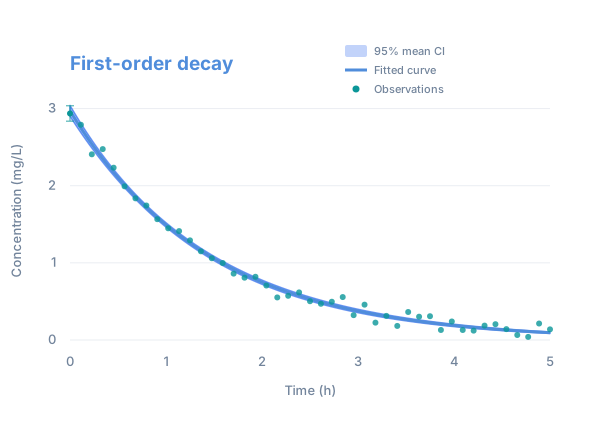
These are approximate pointwise 95% mean confidence intervals under an unknown common Gaussian variance. They are not simultaneous bands or prediction intervals. Continue the quickstart to make those distinctions explicit.
Install from source
The release candidate is installable from the repository. These docs do not imply a PyPI publication. See installation for supported versions and the verification record for checks executed.
Find your next step
| Goal | Start here |
|---|---|
| Install and fit a first model | Installation · Quickstart |
| Choose an inference method | Workflow guide |
| Understand variance, likelihood and identifiability | Statistical concepts |
| Run a complete scientific example | Eleven executable examples |
| Look up arguments, returns and exceptions | Source-generated API |
| Contribute or inspect scientific validation | Development · Scientific review |